Mission data table allows you to create a filtered mission list view, and choose which data columns you want to include in the Report.
- Go to the Dashboard in your Logmore Cloud.
- Scroll down to the bottom of the page and select Add report.

- Select Mission datatable.
- Add filter(s) for the report to display the missions you're interested in (e.g., only with alerts triggered or shipped via a certain route or for a specific time period). Check this article for more details on adding filters.
- Click Next.
- Choose which data columns you want to include in the Report (including your Custom fields) and in which order. We recommend choosing 1-4 most relevant columns.
- Select in which order you want the data to be organized. By default, Starts at (Descending) is selected, namely the Mission's starting time, from the most recent till the oldest.
- Click Next.
- Enter the Report name to match the type of data displayed.
- Click Save report.
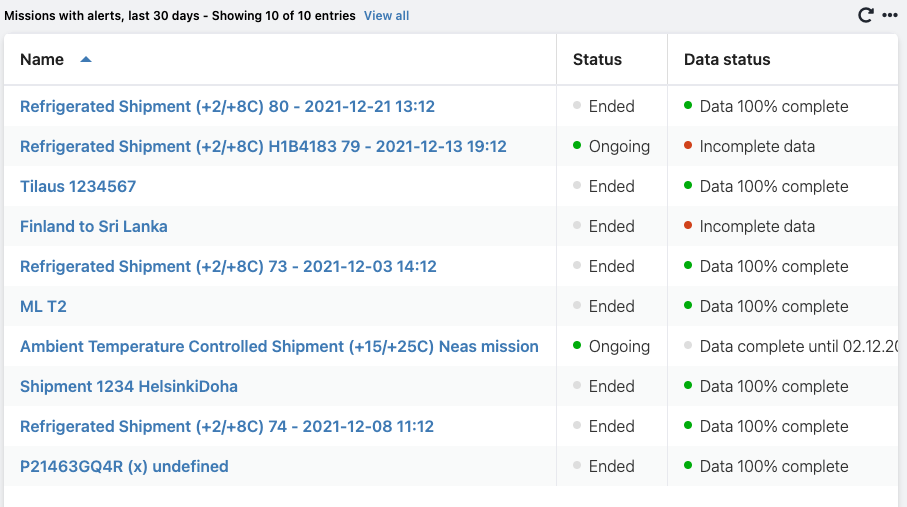
For example, this report shows the Missions with alerts for the last 30 days. The data column Data status helps to point out at Missions where data is incomplete.