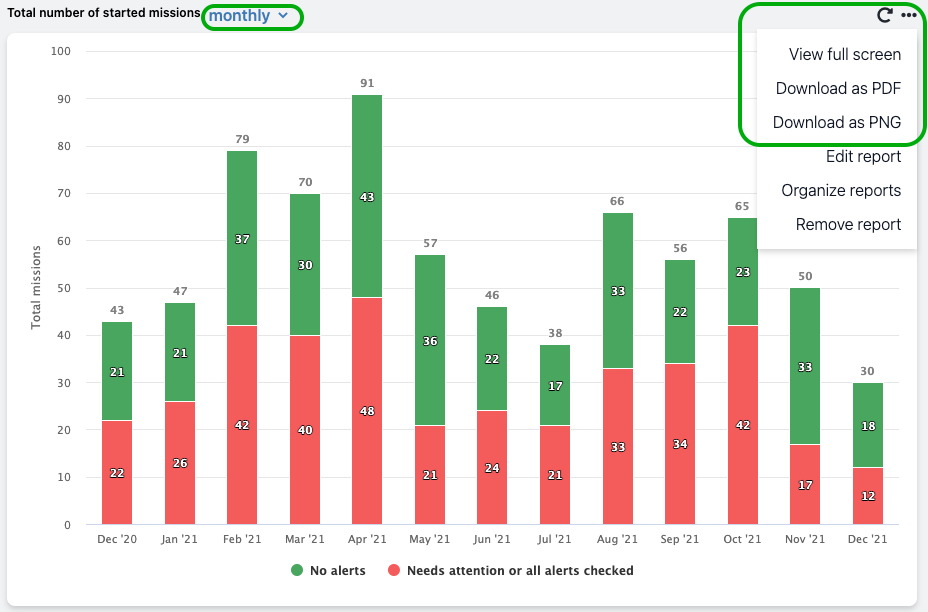
Total number of started missions will show the monthly or weekly breakdown of successful missions or missions with alerts. You are able to download the report image as PDF or PNG.
- Go to the Dashboard in your Logmore Cloud.
- Scroll down to the bottom of the page and select Add report.

- Select Total number of started missions.
- Add filter(s) for the report to display the missions you're interested in (e.g., only with alerts triggered or shipped via a certain route or for a specific time period). Using Custom fields for filtering missions will gain you additional insights. Check this article for more details on adding filters.
- Click Next.
- Enter the Report name to match the type of data displayed.
- Click Save report.
- Once the Report is ready, you are able to edit its time interval. The default interval is monthly. To change it, click monthly (next to the report's name) and select weekly instead.
- Clicking ... on top of the report will let you view the report in full screen or download it as PDF or PNG.
- You can hover with the mouse over any bar to view that month/week in detail. Clicking on that bar will bring you to the Missions page and show only the Missions in question.