Once you've logged into Logmore Cloud, you will see your Dashboard. The Dashboard provides a birds-eye view of your monitoring activities. You are able to track patterns and identify bottlenecks from your monitoring data, as well as get insights on the areas most relevant for you.
With Reports, you are able to see, for example:
- the breakdown of successful and failed missions by month
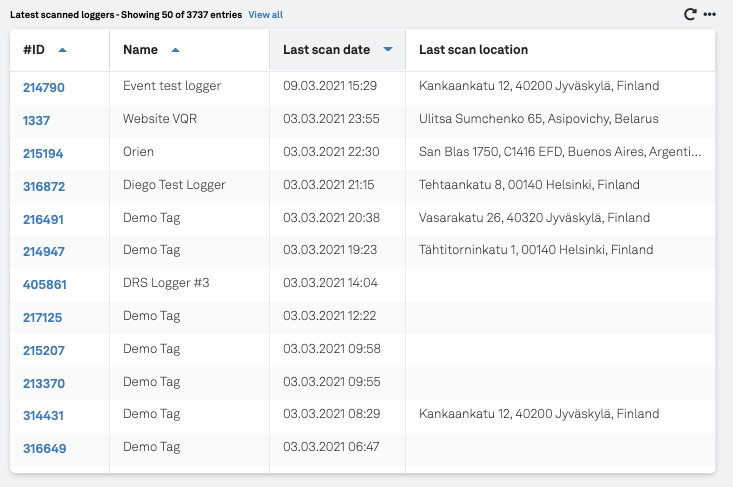
- a list of loggers that have recently been scanned
- the number of alerts filtered by your own custom field
- the scan locations
Here you will learn more about its functionalities and available reports:
Missions with alerts breakdown (recommended)
Mission data table (default)
Total number of started missions (default)
Logger data table (default)
Locations of last 100 scanned loggers
Missions on map (default)
Mission group overview (recommended)
For adding reports to your Dashboard, jump to this article with detailed instructions.
Dashboard
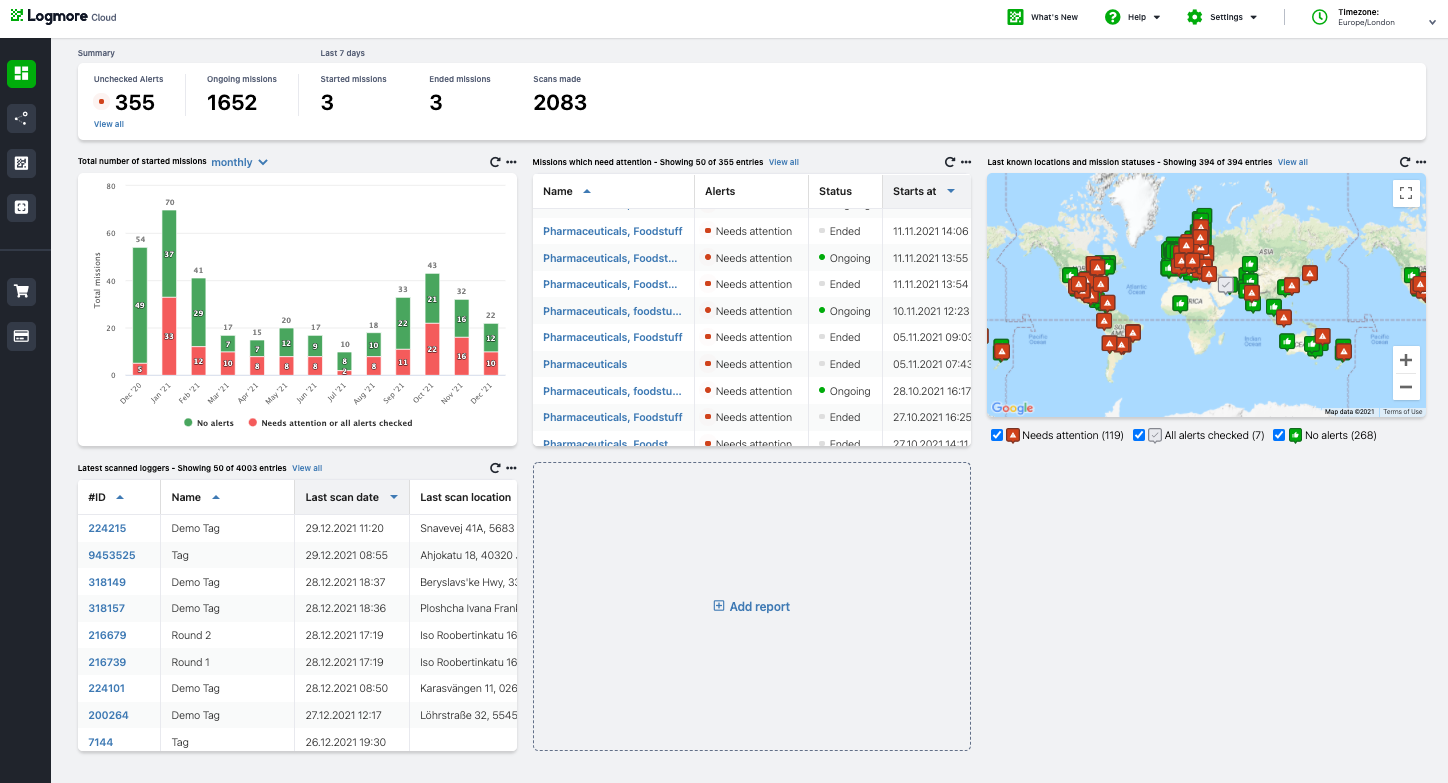
The Dashboard consists of a Summary panel and a combination of different Reports.
The Summary contains:
- the number of unchecked alerts
- the number of ongoing Missions
- your statistics for the last 7 days (ended and started Missions and scans made)
Below are various Reports. Every user is able to add and edit Reports to match what they are interested in. The dashboards are user-specific: the Reports you add will only be visible in your Logmore account.
You can return to the Dashboard by clicking the first button on the left navigation panel.
Report types
Reports allow you to gain more focused and detailed views on your monitoring activities. Reports are data charts in the Dashboard that contain mission and logger data, organized by the filters you define.
There is a variety of different report types to choose from to be able to see the most meaningful things. Every user will have a set of reports by default on their Dashboard. Default reports can be edited to match your preferences.
You are able to add as many Reports to the Dashboard as you wish by clicking Add report at the end of the page. Refer to these articles to learn more on how you can add Reports and reorganize your Dashboard or edit and remove existing Reports.
Missions with alerts breakdown (recommended)
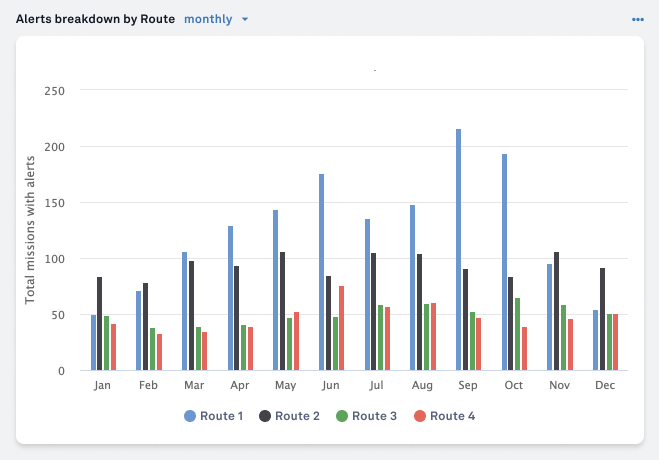
The report on Missions with alerts breakdown captures all missions that contain alerts, categorized by the factor you have chosen.
Mission data table (default)
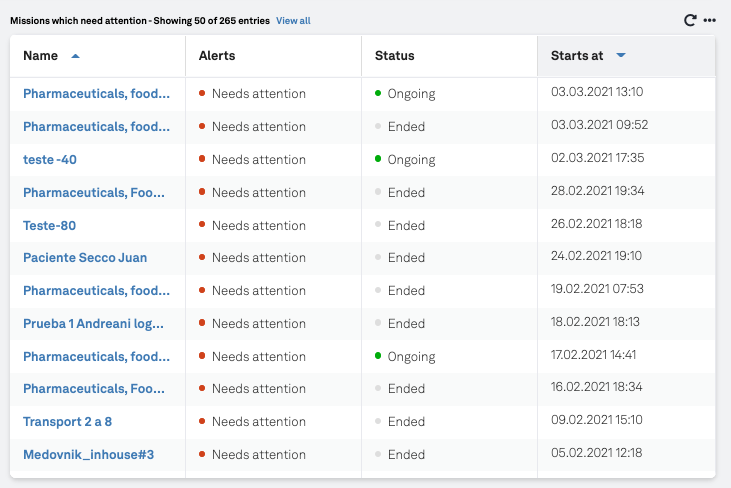
Mission datatable allows you to create a filtered mission list view and choose which data columns you want to include in the Report.
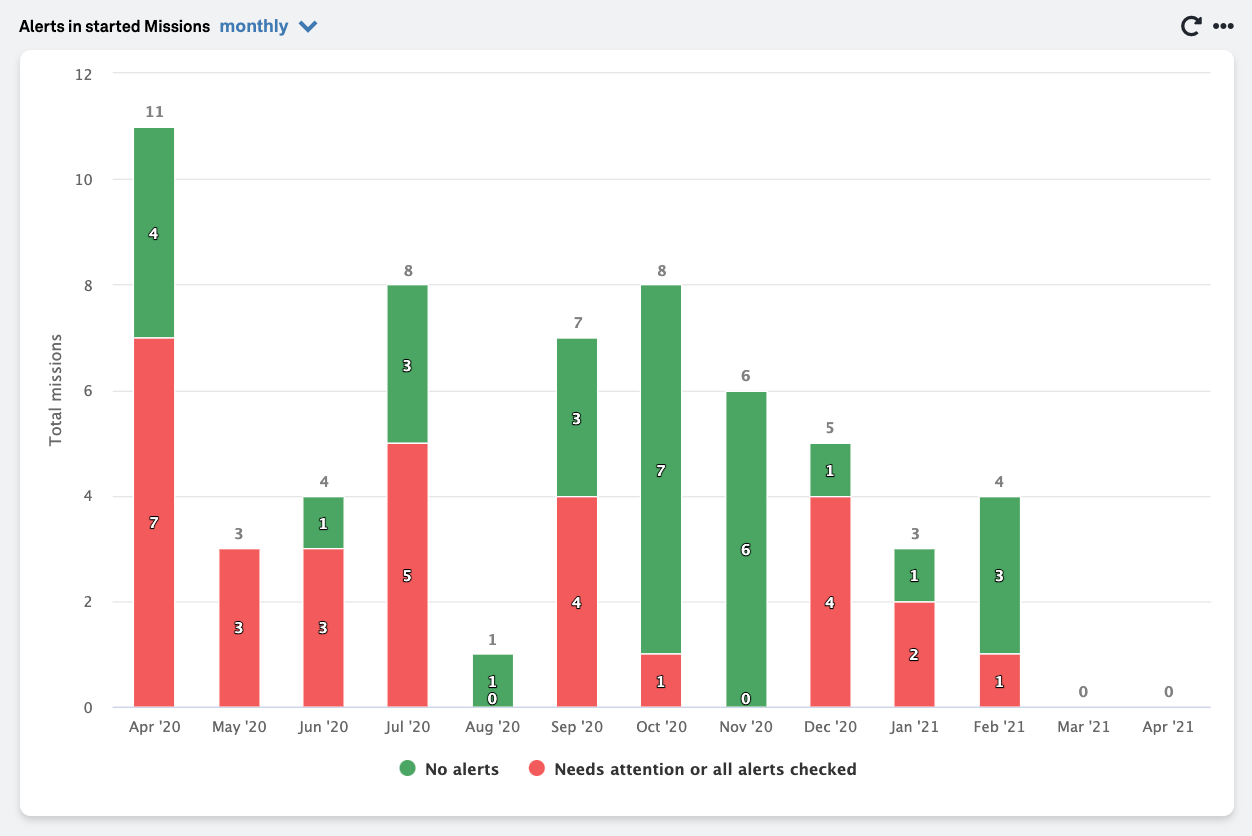
Total number of started missions (default)
A total number of started missions will show the monthly or weekly breakdown of successful missions versus missions with alerts. You are able to download the report image as png or pdf.
Logger data table (default)
Logger datatable allows you to create a filtered logger list view, and choose which data columns you want to include in the Report.
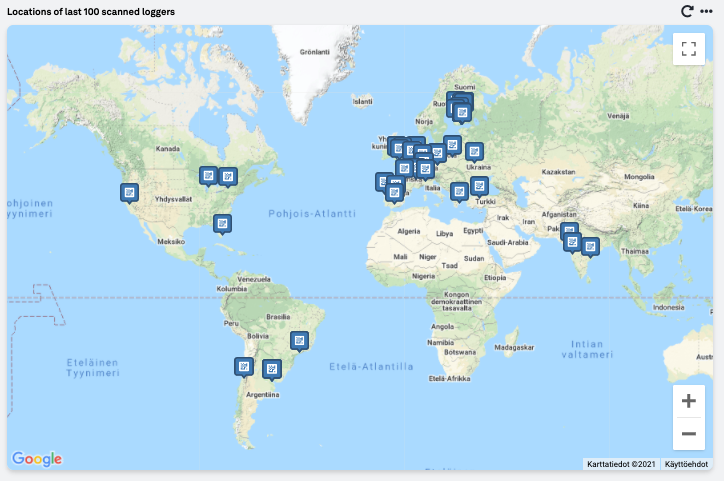
Locations of last 100 scanned loggers
A map with the locations of the last 100 scanned loggers shows the locations of the 100 most recently scanned loggers (if access to the location was allowed when scanning the logger).
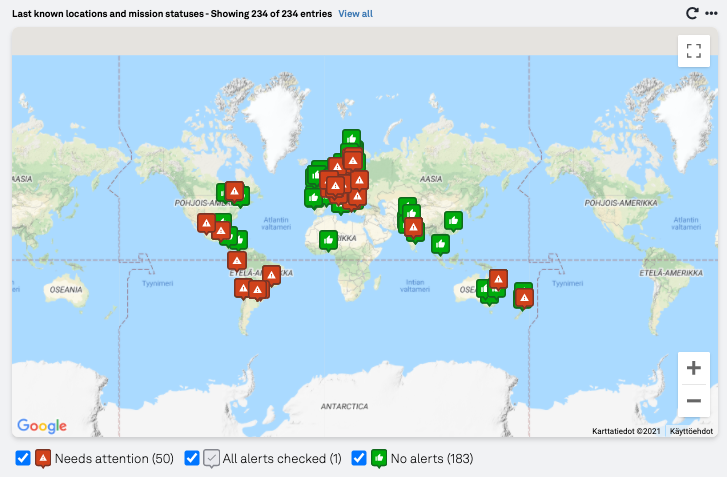
Missions on map (default)
The report Missions on map shows the last known locations of missions on a map. The locations will show the alert status: no alerts, alerts checked, or mission needs attention.
Mission group overview (recommended)
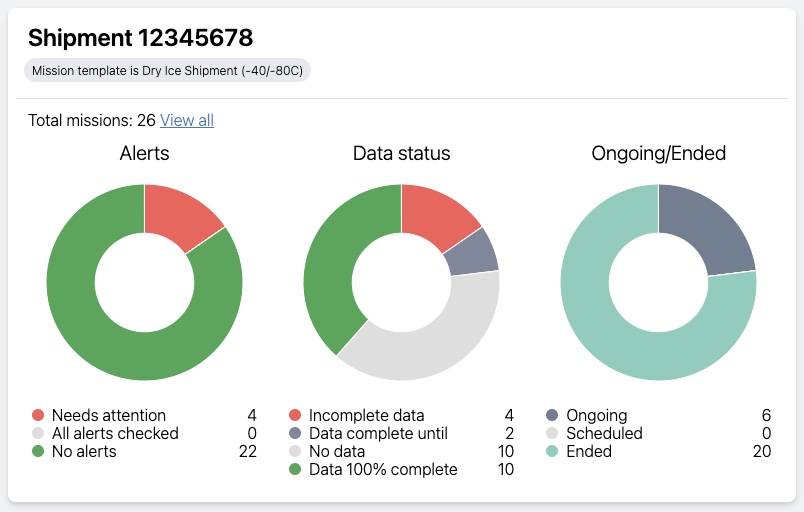
Mission group overview shows the general status (alerts, data status, ongoing/ended) of a particular group of missions. The amount of missions corresponding to each subcategory is indicated.
