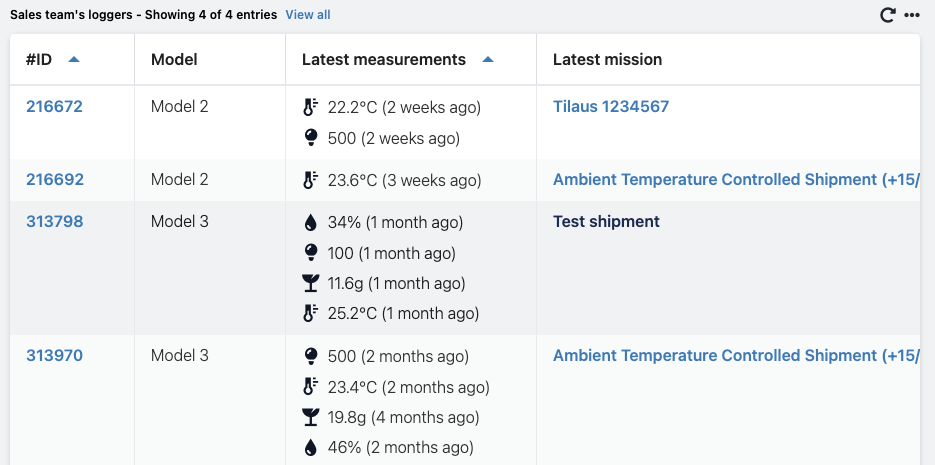
Logger data table allows you to create a filtered logger list view, and choose which data columns you want to include in the Report.
- Go to the Dashboard in your Logmore Cloud.
- Scroll down to the bottom of the page and select Add report.

- Select Logger datatable.
- Add filter(s) for the report to display the loggers you're interested in.
- Click Next.
- Choose which data columns you want to include in the Report (including your Custom fields) and in which order. We recommend choosing 1-4 most relevant columns.
- Select in which order you want the data to be organized. By default, the Last scan date (Descending) is selected.
- Click Next.
- Enter the Report name to match the type of data displayed.
- Click Save report.
For example, this report shows the loggers belonging to a specific team, their models and measurements, and last missions.
