This section covers the instructions on managing loggers on the Loggers page in Logmore Cloud.
In this article:
Locate and edit the Loggers table
Search and add filters to the Loggers table
Download the Loggers table as an Excel
Locate and edit the Loggers table
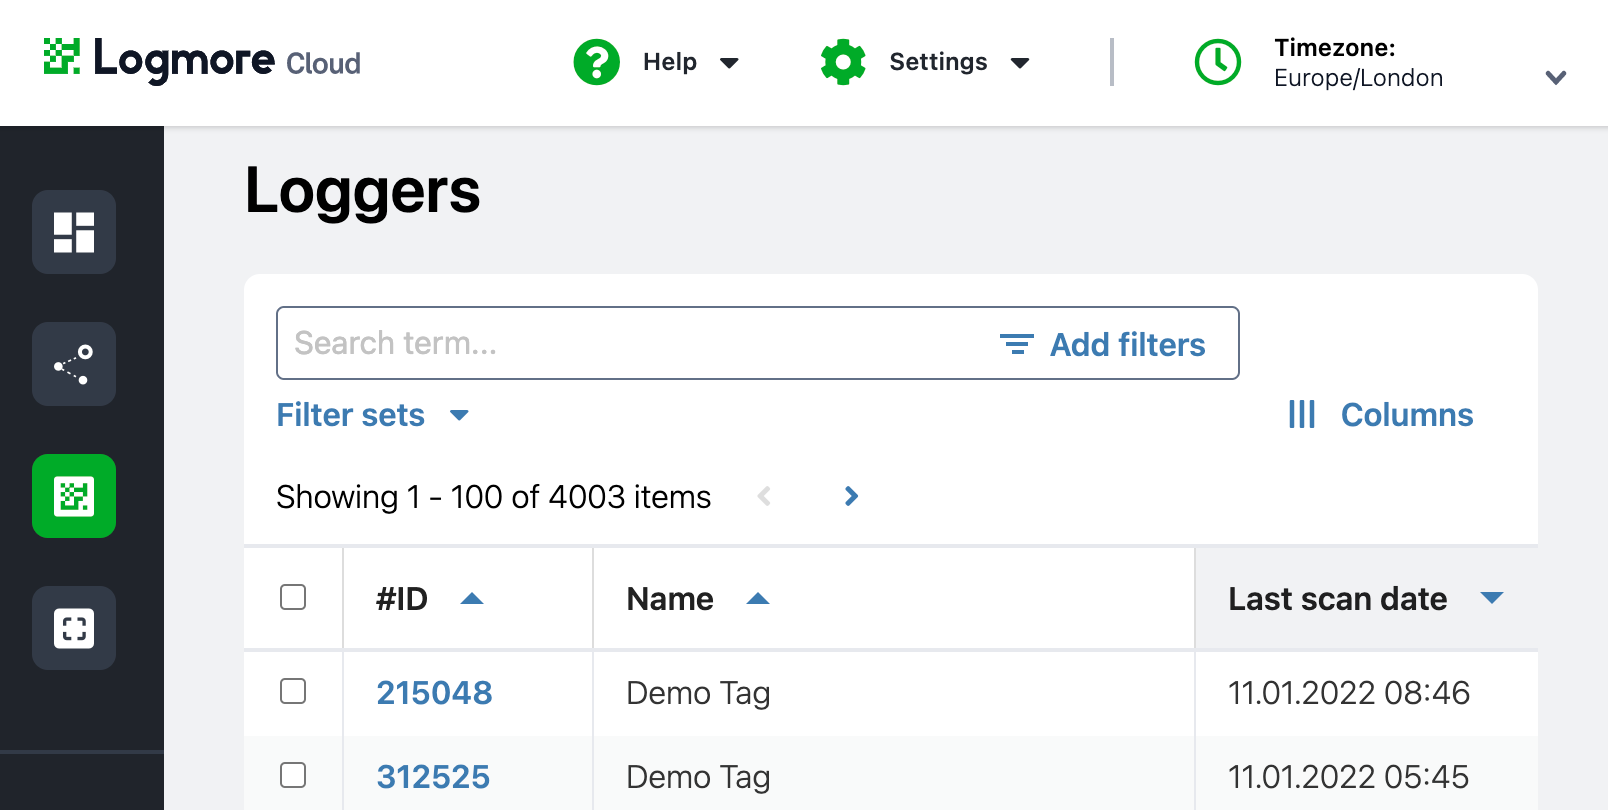
- The Loggers page is located on the left navigation panel. From there, you will see a table with all your active Loggers.

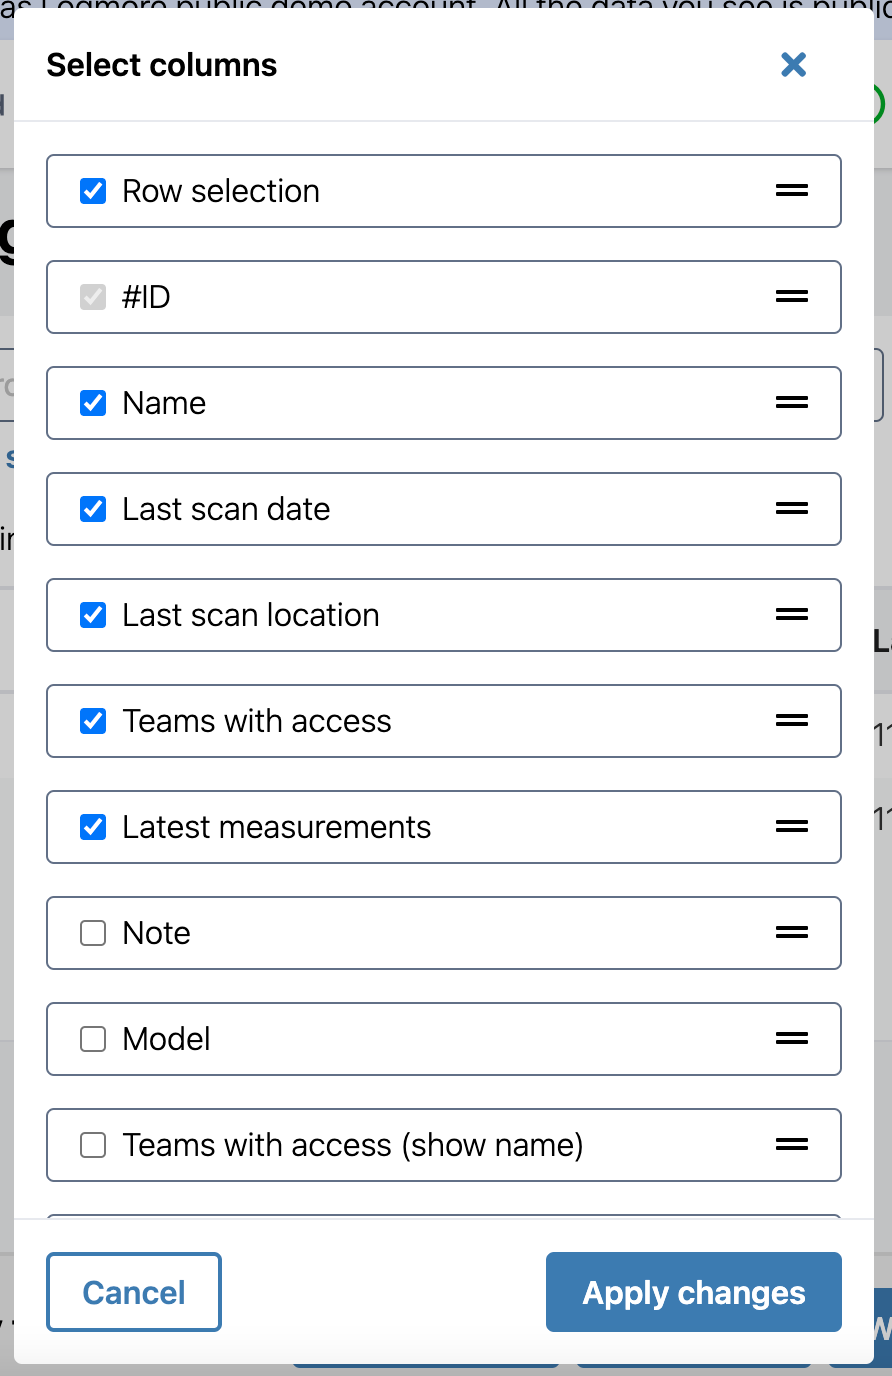
- To configure the data shown in the table, click Columns.
- Select the information you want to see in the table and click Apply changes.

- Now the table shows only the columns you have chosen.
- You can sort certain entries in alphabetical order or based on the date by clicking the arrow (▲ or ▼) next to the column's name.
Search and add filters to the Loggers table
You can search for any Logger by a key term or create filters to see only the Loggers with specific parameters (for example, based on the model, last scan location, or teams with access).
- For a simple search, enter the term in the search field above the Loggers table. You can search by the logger ID, name, or last scan location.
- For an advanced search, select Add filters. A new window will open.
- You can base the filter on a search for a specific term in your Loggers' data (for example, the last scan location).
- Create a filter for a specific data type to see only Loggers that fall under the filter set.
- Click +Add filter to apply multiple filters at the same time.
When you add multiple conditions, only the loggers are shown that satisfy ALL the conditions specified. - To save this filter for further use, click Save filter set. Name it.
- If you don't want to save the filter set for further use, click Apply changes.
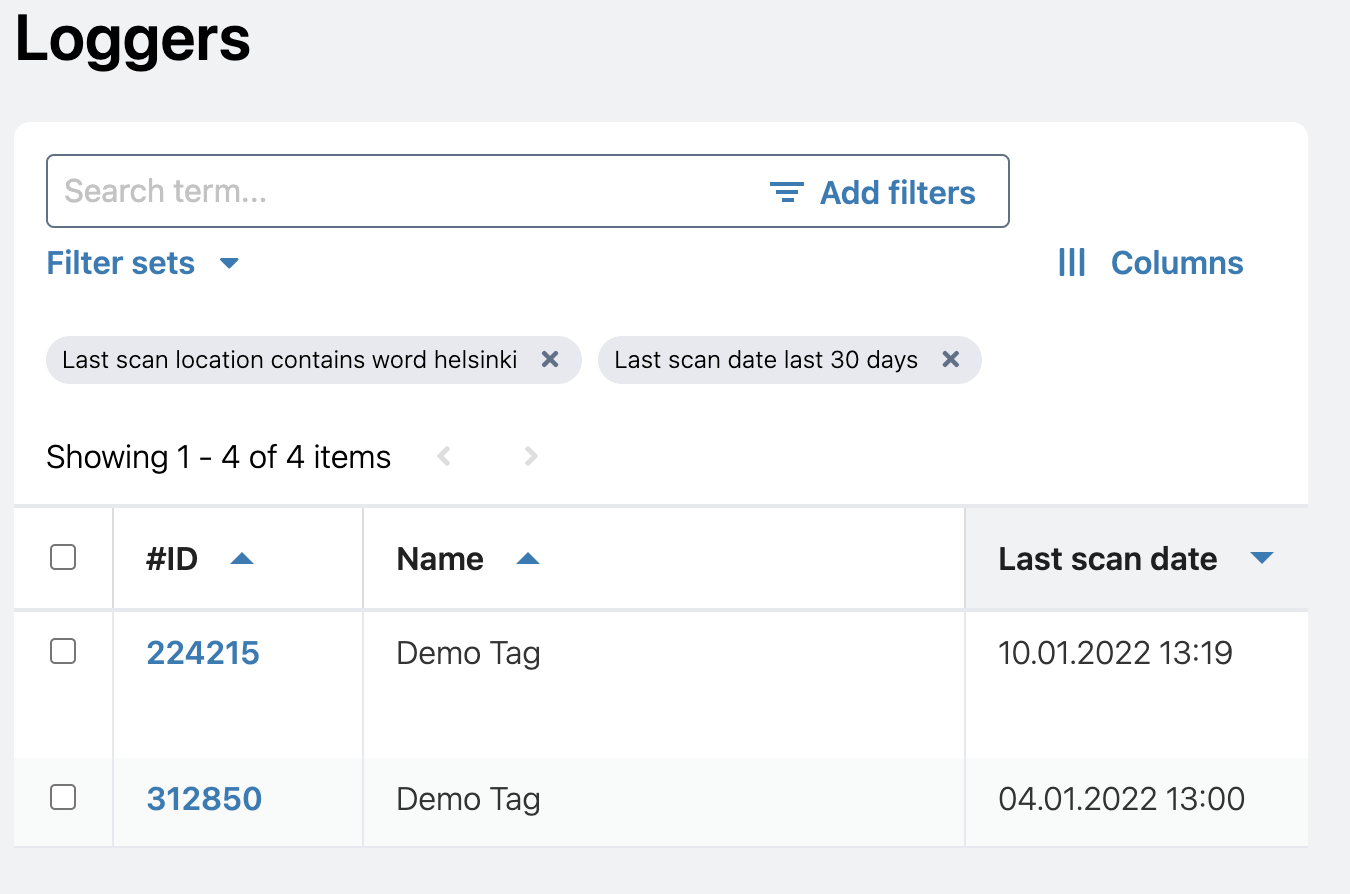
- You will see the filtered results in the table.
- To access saved Filters, click Filter sets and select the one you need.
For example, this filter set shows only the Loggers scanned within the last 30 days in Helsinki.

Download the Loggers table as an Excel
You can export the Loggers table as an Excel — as is or with filters applied. You will get a table with an overview of all or selected Loggers. Note that it will contain metadata but not the measurement data. For downloading measurements in Excel, check this article.
- Configure the data shown in the table by clicking Columns to the right on the Loggers page (see above).
- Select the Loggers you want to appear in the table.
- Select individual Loggers by checking the box next to that logger's ID.
- Select all Loggers on the list by checking the box next to Name in the first row.
- Apply filters (based on date, data status, etc.) to select only relevant Loggers. Check the box next to Name in the first row to select the filtered items (see above).
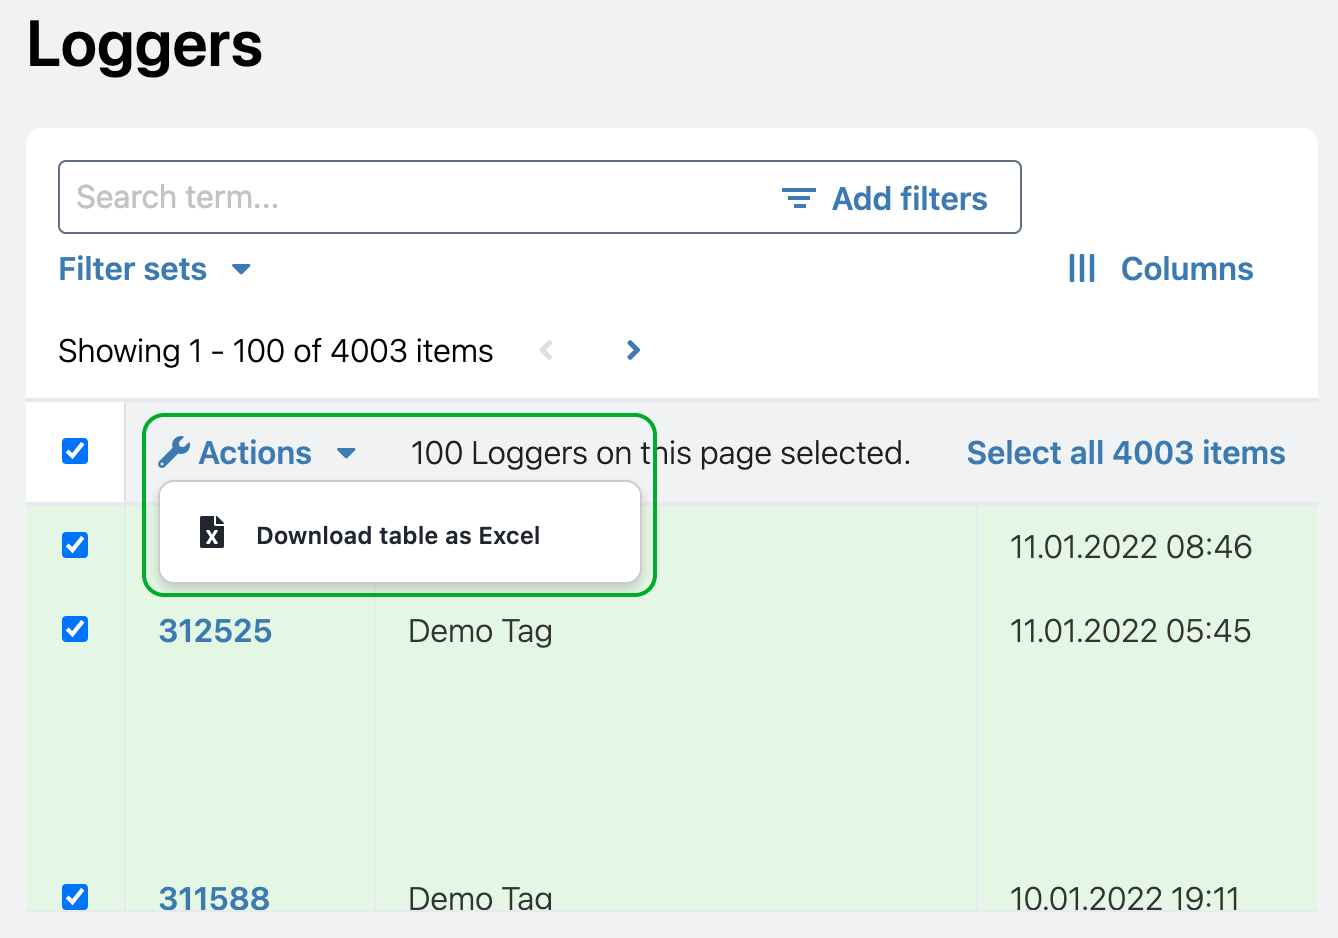
- Click Actions in the top row and select Download table as Excel.
- The file will be immediately downloaded to your device.
