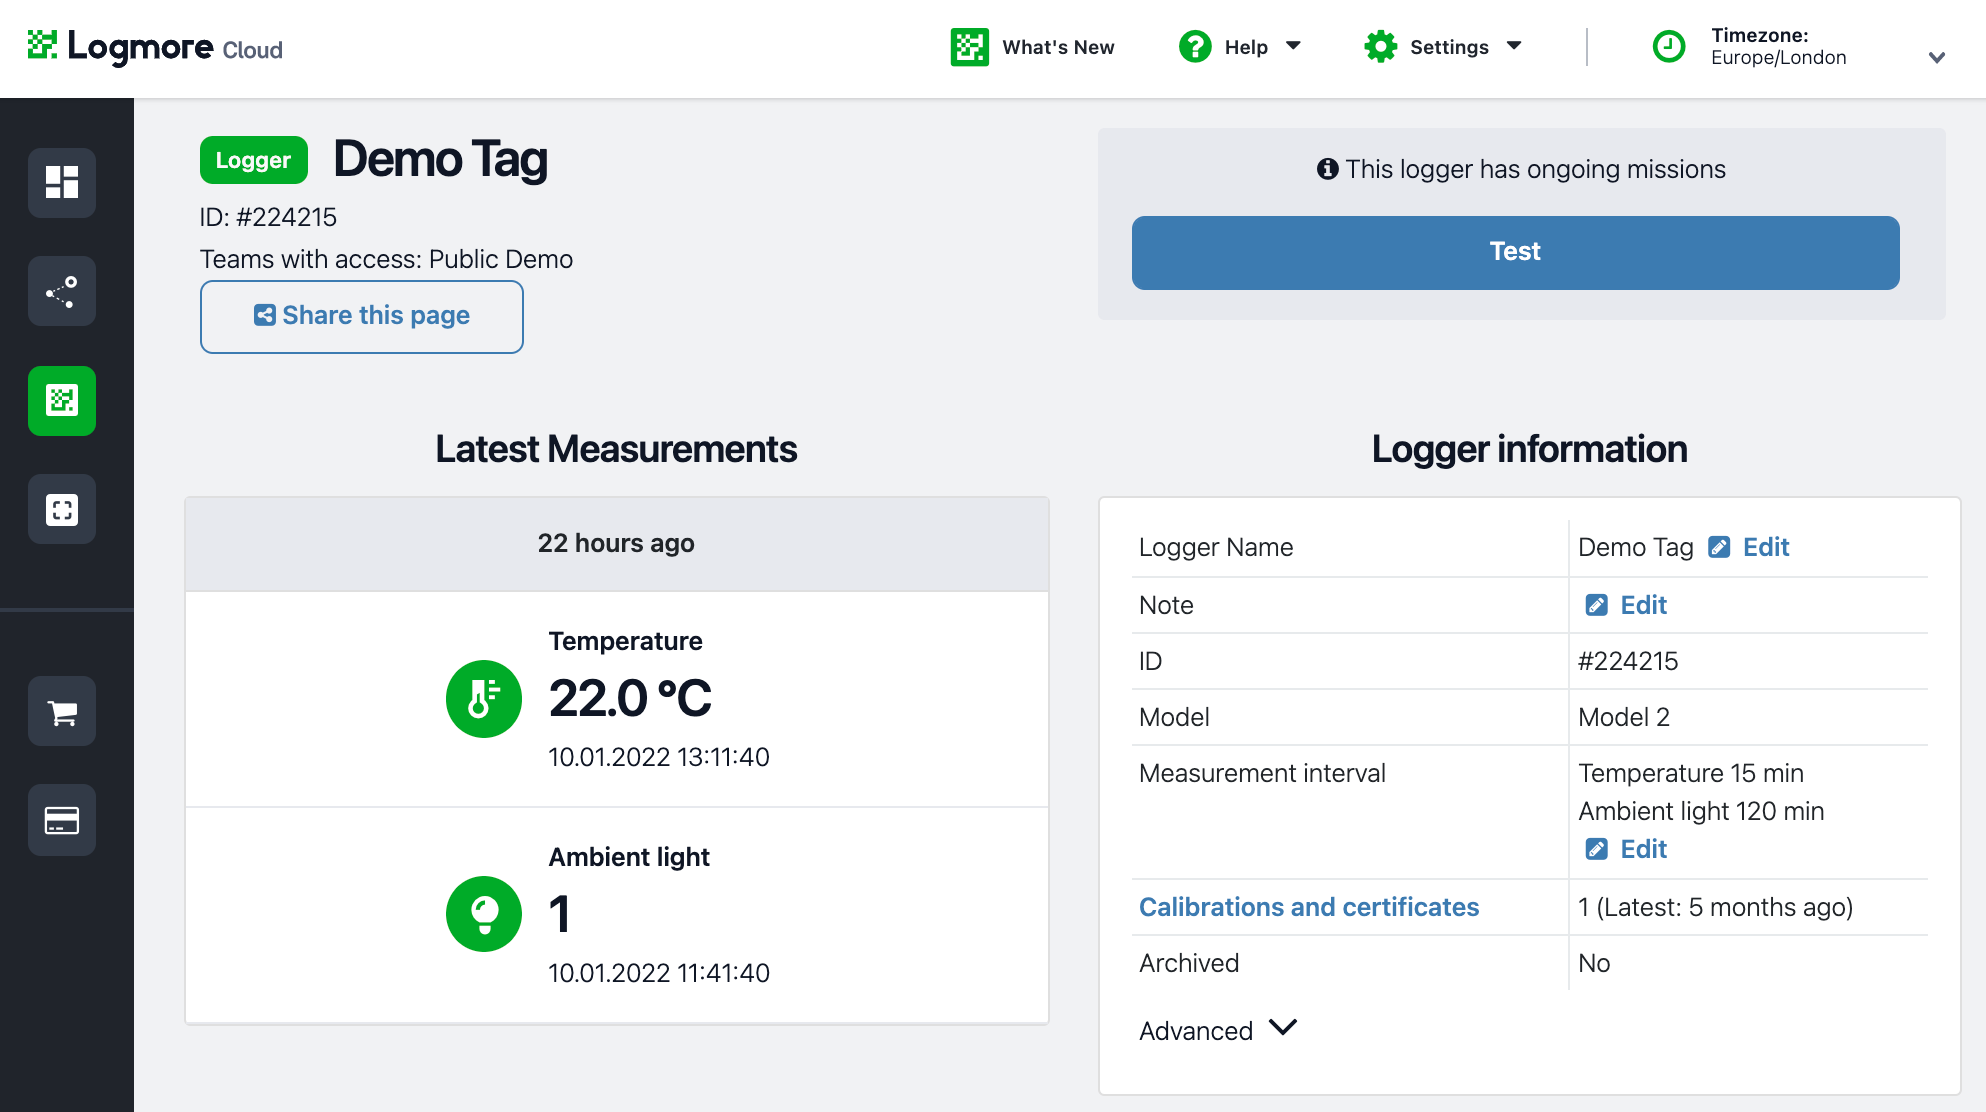
Each individual logger has its own page, and it is a central way to manage the measurement and location data, as well as settings, of any single Logmore QR logger.
The easiest way to locate a single logger is to go to the Loggers page (left navigation panel), search for the logger, and click on the logger's ID in the table. Check this article for more details about the Loggers page and search options.

On the logger page, you can:
- see the ID, name, and model of the logger
- check the ongoing missions and teams with access
- (re)name the logger
- add a note to the logger
- see the current measurement interval settings
- access setting configuration
- access calibrations and certifications
- view the measurement history as a graph or a list
- add comments
- browse the scan history of the logger
- archive the logger
Access measurement history of the logger
Data from sensors
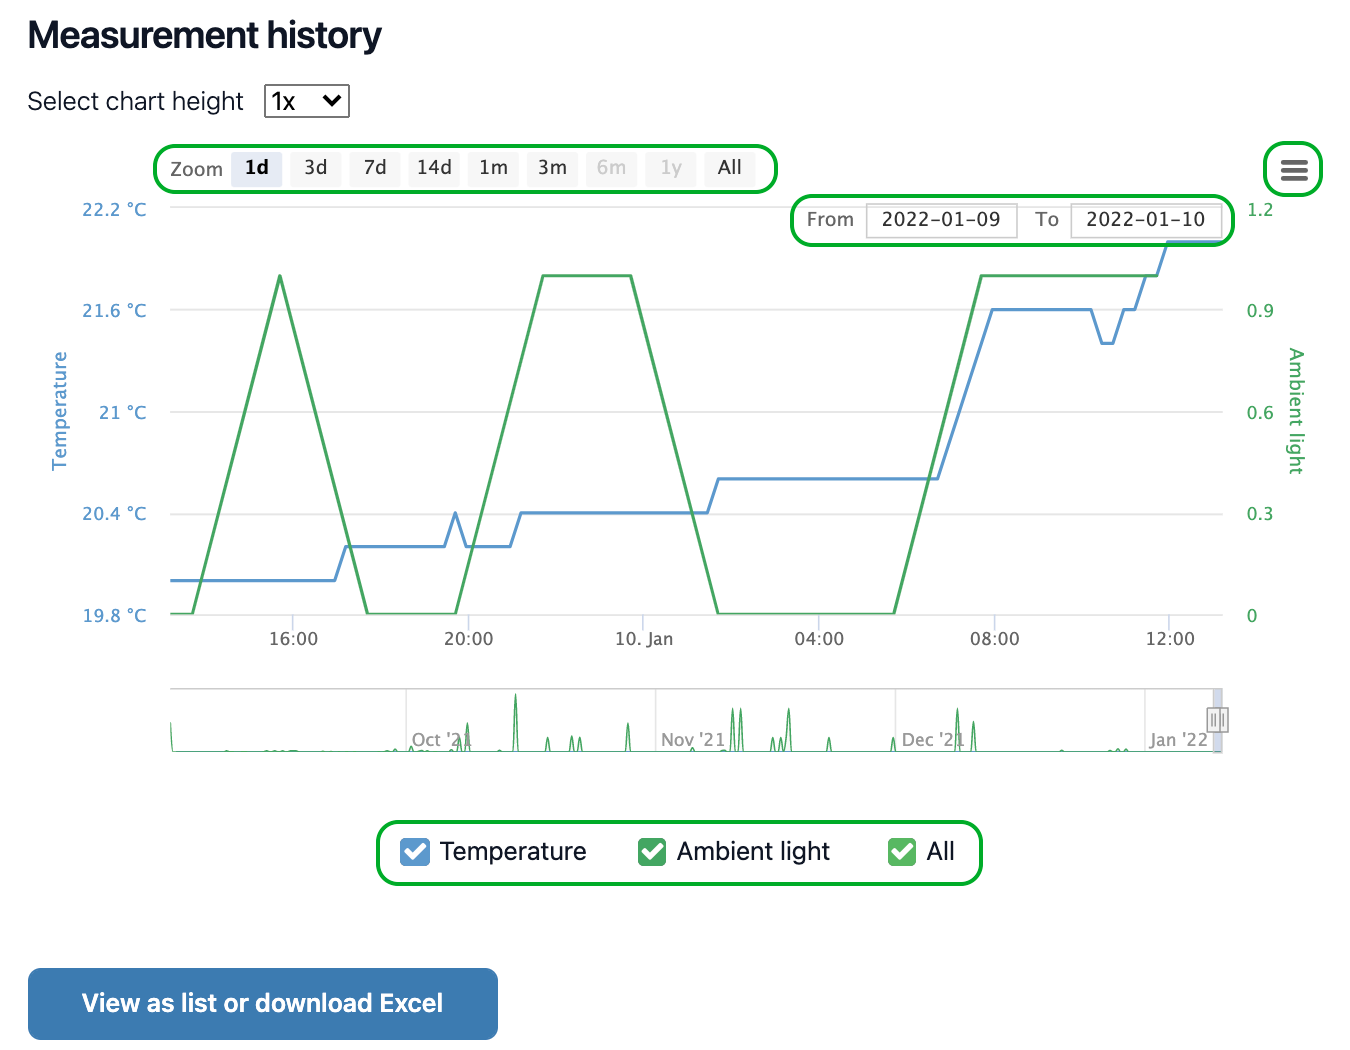
The available measurement data depends on the logger model (the type of sensors) and settings. Some Logmore loggers measure only temperature, others can include ambient light, shocks, or humidity sensors. You can choose the data from which sensor to include in the graph by clicking the checkboxes.
Timeframe
Adjust the graph's timeframe by clicking the boxes on top of the graph: you can choose the period between one day up to the whole logger's lifecycle. You can also select a custom timeframe by adjusting the dates in the box above the graph.
View fullscreen or download the graph
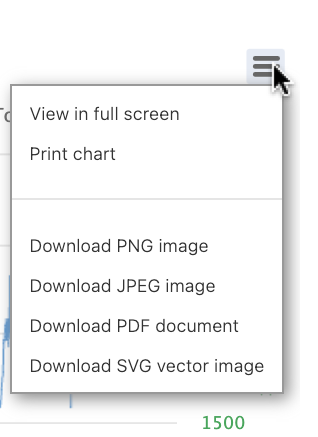
Clicking the button in the top right corner of the graph will open a menu. From there, you can select to view the graph in a fullscreen mode or download the images as a PNG, JPEG, PDF, SVG. 
Download measurement data
Click View as list or download Excel to download the raw measurements. Check this article for more details on downloading raw measurement data.
Check location history
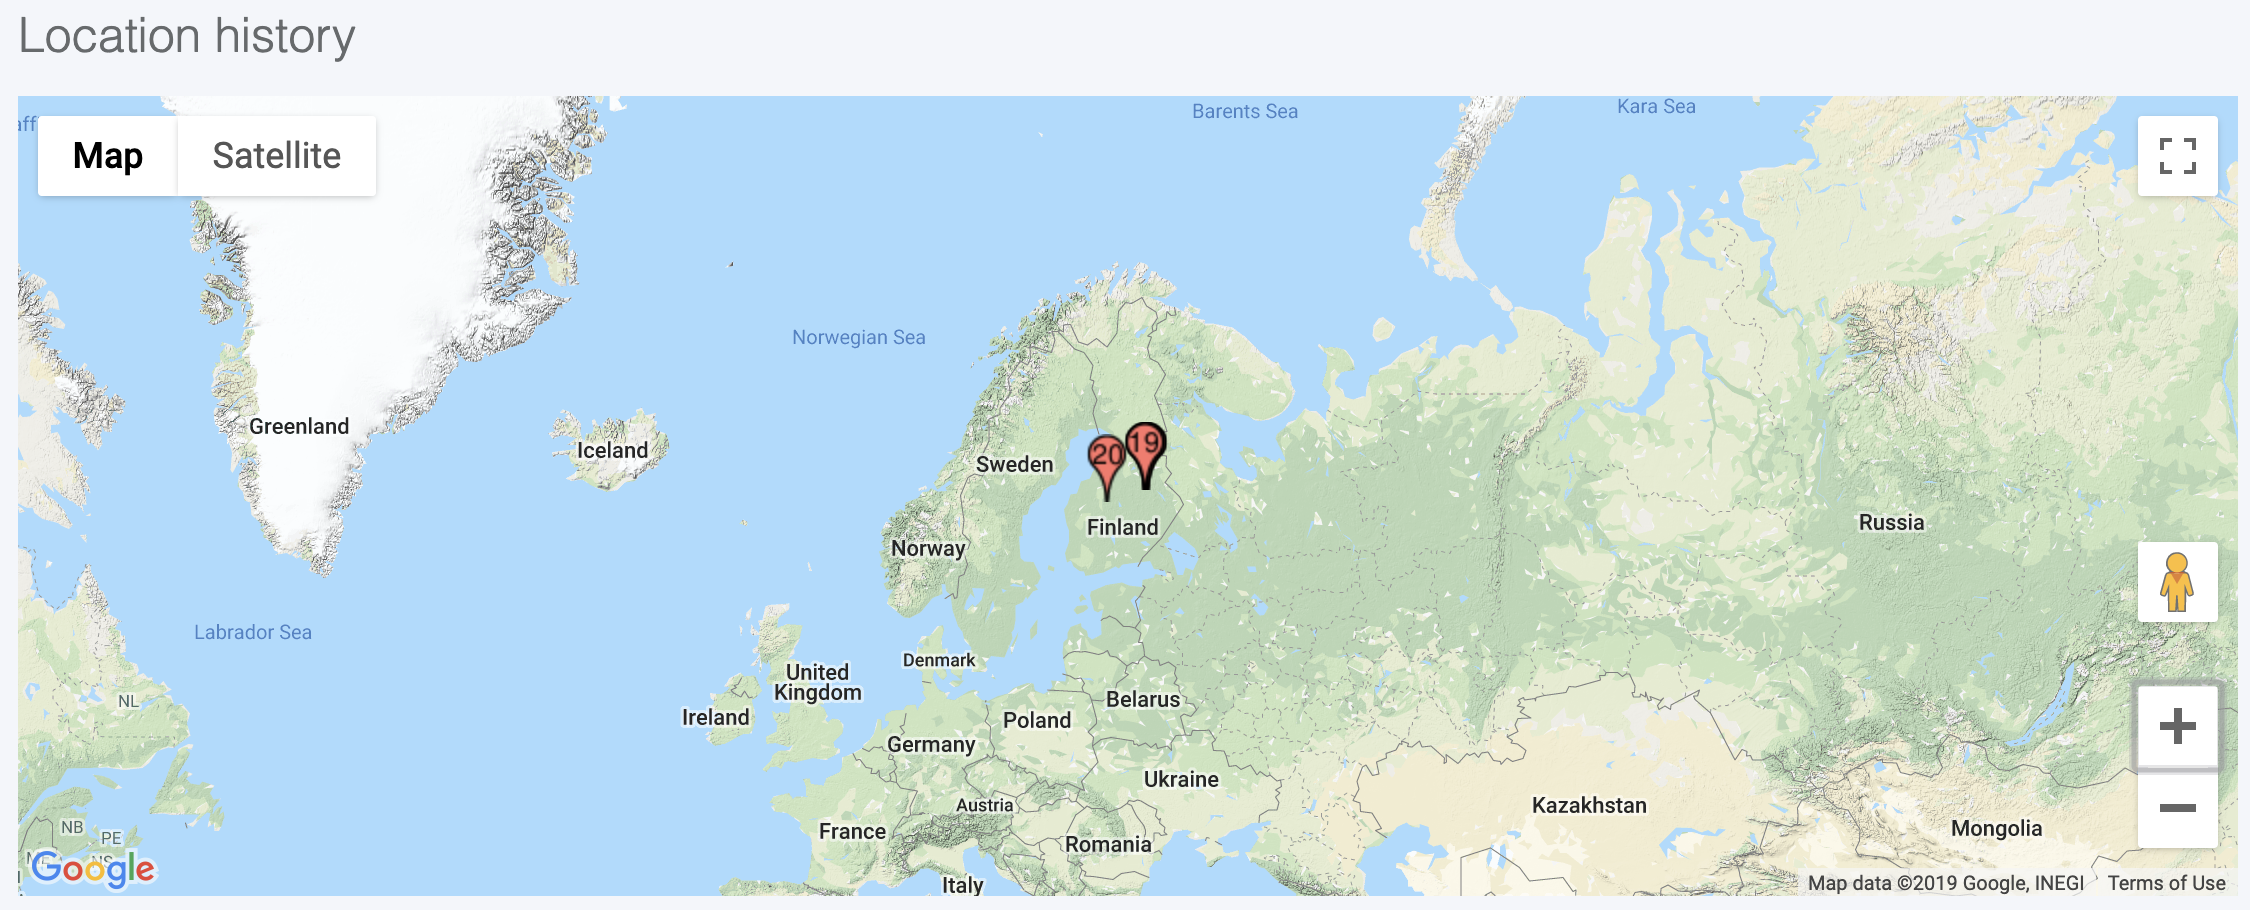
Location history is shown as a map when location data is available. If no location data exists for the logger, the map is replaced with the text "This logger does not have any locations saved yet".
At the bottom of the logger's page, you will see a list with the 50 latest scans.

Check comments
The comment field of the logger page can be used to make any notes, explanations, or observations related to that specific logger.
